Showing posts with label performance. Show all posts

13 December 2010

Query Profiling SQL Azure when using Entity Framework or Linq-to-SQL

One slight shortcoming in Microsoft’s SQL Azure (the SQL Server 2008 flavor that is hosted  in Microsoft’s cloud platform) is that users don’t have the trace privileges needed to use SQL Profiler to profile query and performance behavior. Fortunately there are other ways to extract performance data for individual queries; SQL Azure exposes IO statistics, timings, and execution plans in the same way as normal non-cloud editions of SQL Server.

I have recently done some testing against SQL Azure using my tools. Huagati DBML/EDMX Tools needed some minor adjustments to work against SQL Azure as outlined in a previous blog post: http://huagati.blogspot.com/2010/12/sql-azure-support-in-huagati-dbmledmx.html

Next up was testing the profiling / logging components for Entity Framework 4 and Linq-to-SQL in Huagati Query Profiler against SQL Azure. Fortunately I can announce that it works just fine; the techniques used by the Huagati Query Profiler’s logging components for capturing server-side timings, I/O statistics, query execution plans are all supported in SQL Azure. The log entries will look the same and the same performance data and filtering options that work against local SQL Server instances can be used against SQL Server in the cloud.

queryProfilerAzure

One interesting thing I noticed while testing is that the roundtrip times against the SQL Azure instance I am accessing is only 100-150ms above accessing a database on my local LAN. That is impressive considering I am in Thailand and the SQL Azure instance is in Singapore, and faster than what I have seen mentioned in some forums and blog posts from US SQL Azure users.

To get started, download and install the Huagati Query Profiler from http://huagati.com/l2sprofiler/ and take a look at these blog posts and/or the sample code that is installed together with the profiler:

Linq-to-SQL: http://huagati.blogspot.com/2009/06/profiling-linq-to-sql-applications.html
Entity Framework: http://huagati.blogspot.com/2010/06/entity-framework-support-in-huagati.html

Next, you can either try the sample projects that ship with the profiler against your own SQL Azure instance, or add profiling support to your own Entity Framework 4 or Linq-to-SQL based projects against a SQL Azure database.

09 June 2010

Entity Framework support in Huagati Query Profiler (formerly known as Huagati Linq-to-SQL profiler)

When I first introduced the Huagati Linq-to-SQL Profiler nearly a year ago, I mentioned that it would eventually support other data access technologies than just Linq-to-SQL. Second up was support for LLBLGen profiling released in October 2009. Now the turn has finally come to Microsoft’s Entity Framework 4.0.

The concept is the same, the packaging is the same, and existing licensed users of the profiler can simply install the latest version to add support for Entity Framework query profiling in addition to the already existing Linq-to-SQL and LLBLGen profilers.

Why? Why not use SQL Profiler instead?

Database performance, and conserving db-side resources is often key to app performance in database driven applications. There are many tools around for profiling, and there can sometimes be an overlap between what they do.

The Huagati Query Profiler bridges the gap between SQL Server and OR-mapper code. It collects important information about queries executed by Linq-to-SQL, Entity Framework, and LLBLGen and combines that information with stack traces and other details that make it easier to find out what code in an application is responsible for the most expensive or most long-running database queries. It overlaps with the SQL Server Profiler in collecting query information, with Visual Studio, and with SQL Server Management Studio, but adds the benefit of linking information otherwise available separately in each of the three applications together.

What does it do? How does it work?

The profiler consists of two main parts:

  1. A redistributable runtime DLL that you can reference from and include with your applications. There is one runtime logging DLL for each of EFv4, L2S, and LLBLGen. The runtime logging DLL collects information about what queries are executed against the database along with useful information such as timings, I/O cost, execution plans, and various feedback from SQL Server's query optimizer.
  2. The profiler log explorer application that is used for exploring logs generated by the runtime DLL, and examining individual log entries in more detail.

Filters

Filters can be set up in both layers; in the runtime component to avoid logging non-costly queries or to narrow down on specific types of query behavior, and in the log explorer to narrow down specific types of queries when examining existing logs.

The logging components have several built-in filters, and custom filters can easily be added if needed.

Code samples

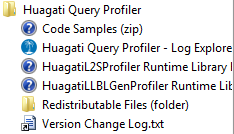
After installing the profiler, Windows Programs menu will get a new program group called Huagati Query Profiler:

Huagati Query Profiler program group

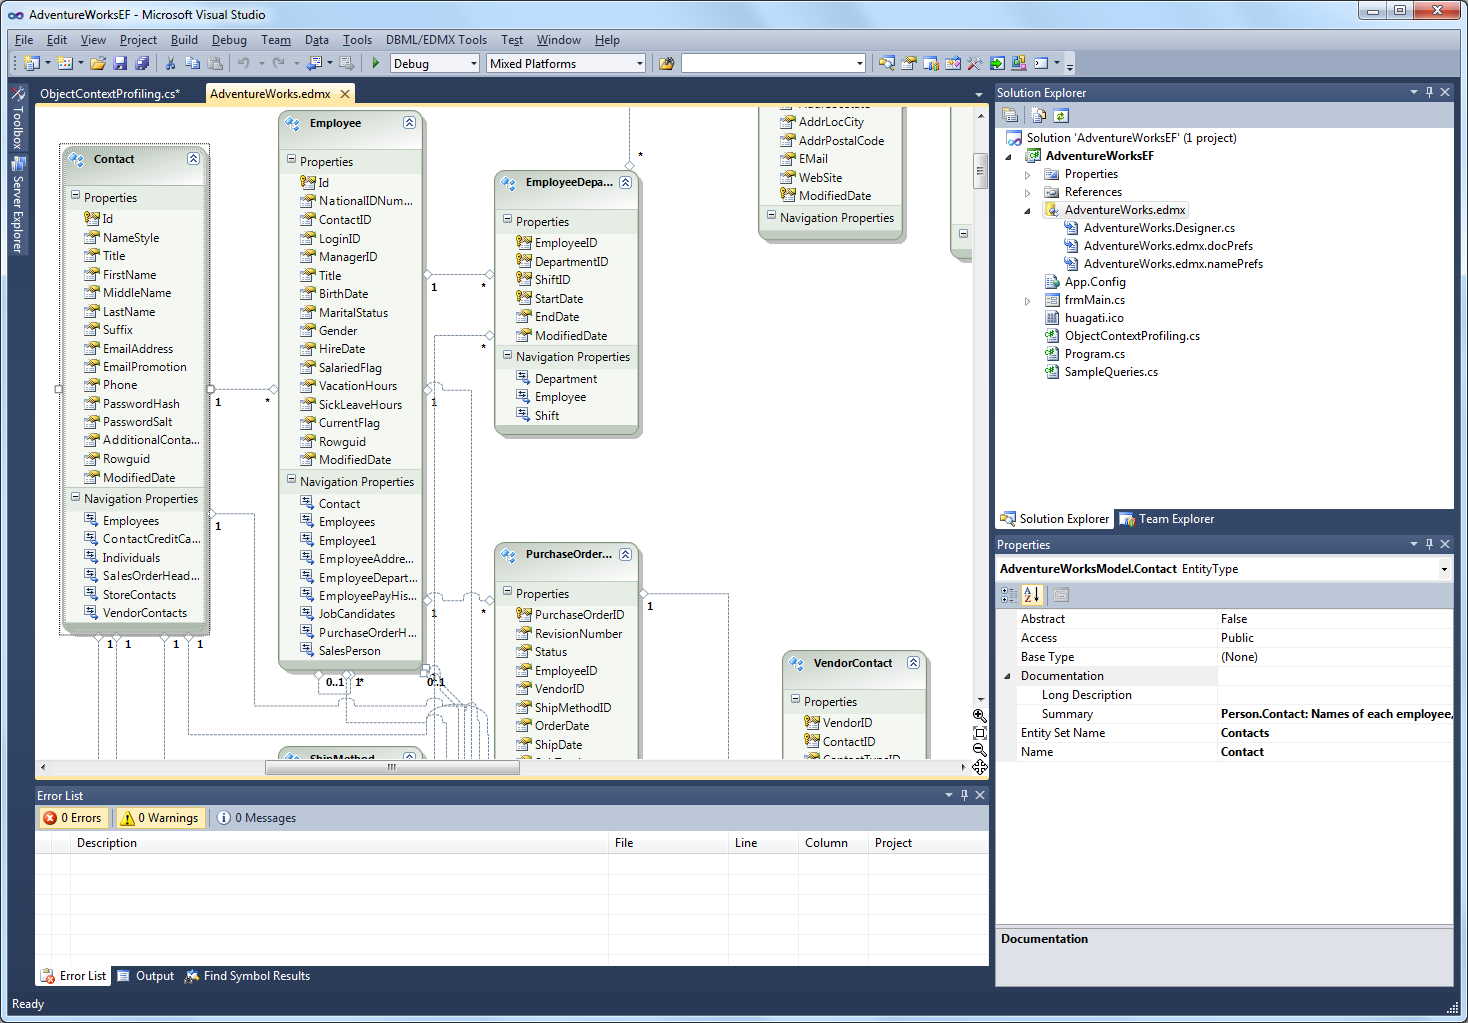
The first entry, Code Samples (zip) will open up a zip file containing a handful of sample Visual Studio projects in C# and VB. The sample projects shows how to integrate the runtime component with an existing application, and includes sample queries showing some typical operations. The Entity Framework 4 sample is called AdventureWorksEF and it uses the Microsoft AdventureWorks sample database.

AdventureWorks EF model in Visual Studio 2010
AdventureWorks EF model in VS2010 (click for larger image)

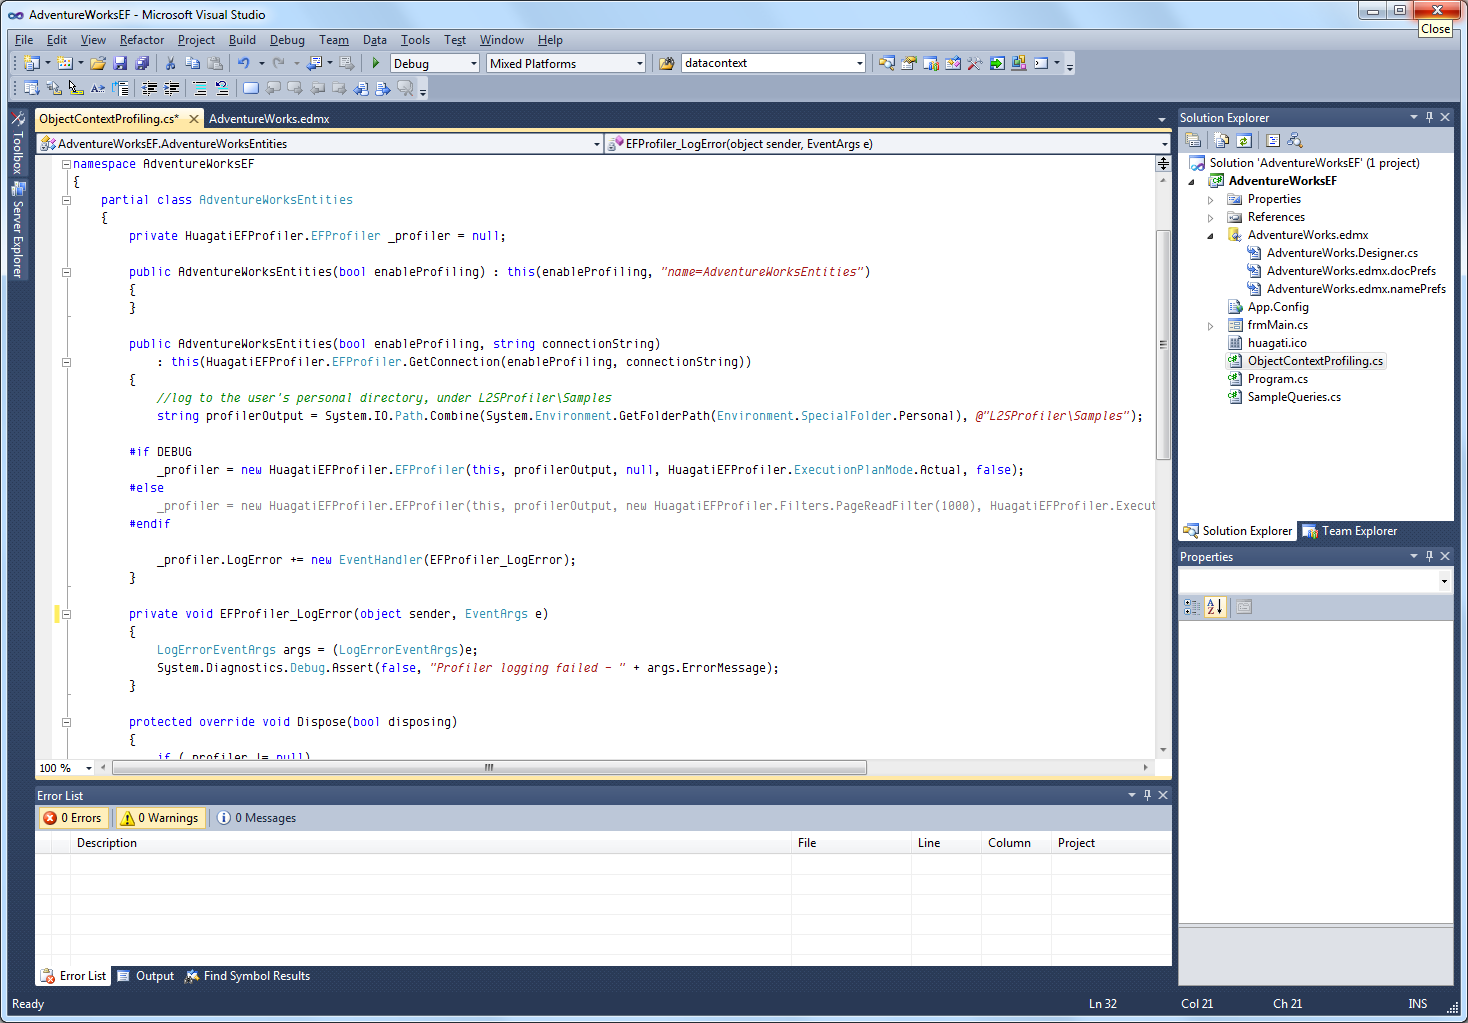
Sample EFv4 ObjectContext with profiler logging
Sample ObjectContext with EF Profiling support added (click for larger image)

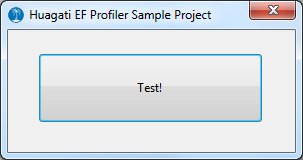
The UI of the sample project is simple, a small form with a single button. Behind the button are several sample queries, some doing a simple primary key lookup, others doing group/aggregate queries etc.

Sample query in the EFv4 profiler logging code sample
Query in the code samples project (click for larger image)

To generate some sample log entries for the log explorer, run the sample project and click on the Test! button.

TestProjectUI
Code sample project UI: a single button

Before running the sample project, ensure that the connection string in app.config is pointing to where you have installed the Microsoft AdventureWorks sample database.

The profiler log explorer

After generating log entries, start up the Profiler Log Explorer (Start/All Programs/Huagati Query Profiler/Huagati Query Profiler-Log Explorer).

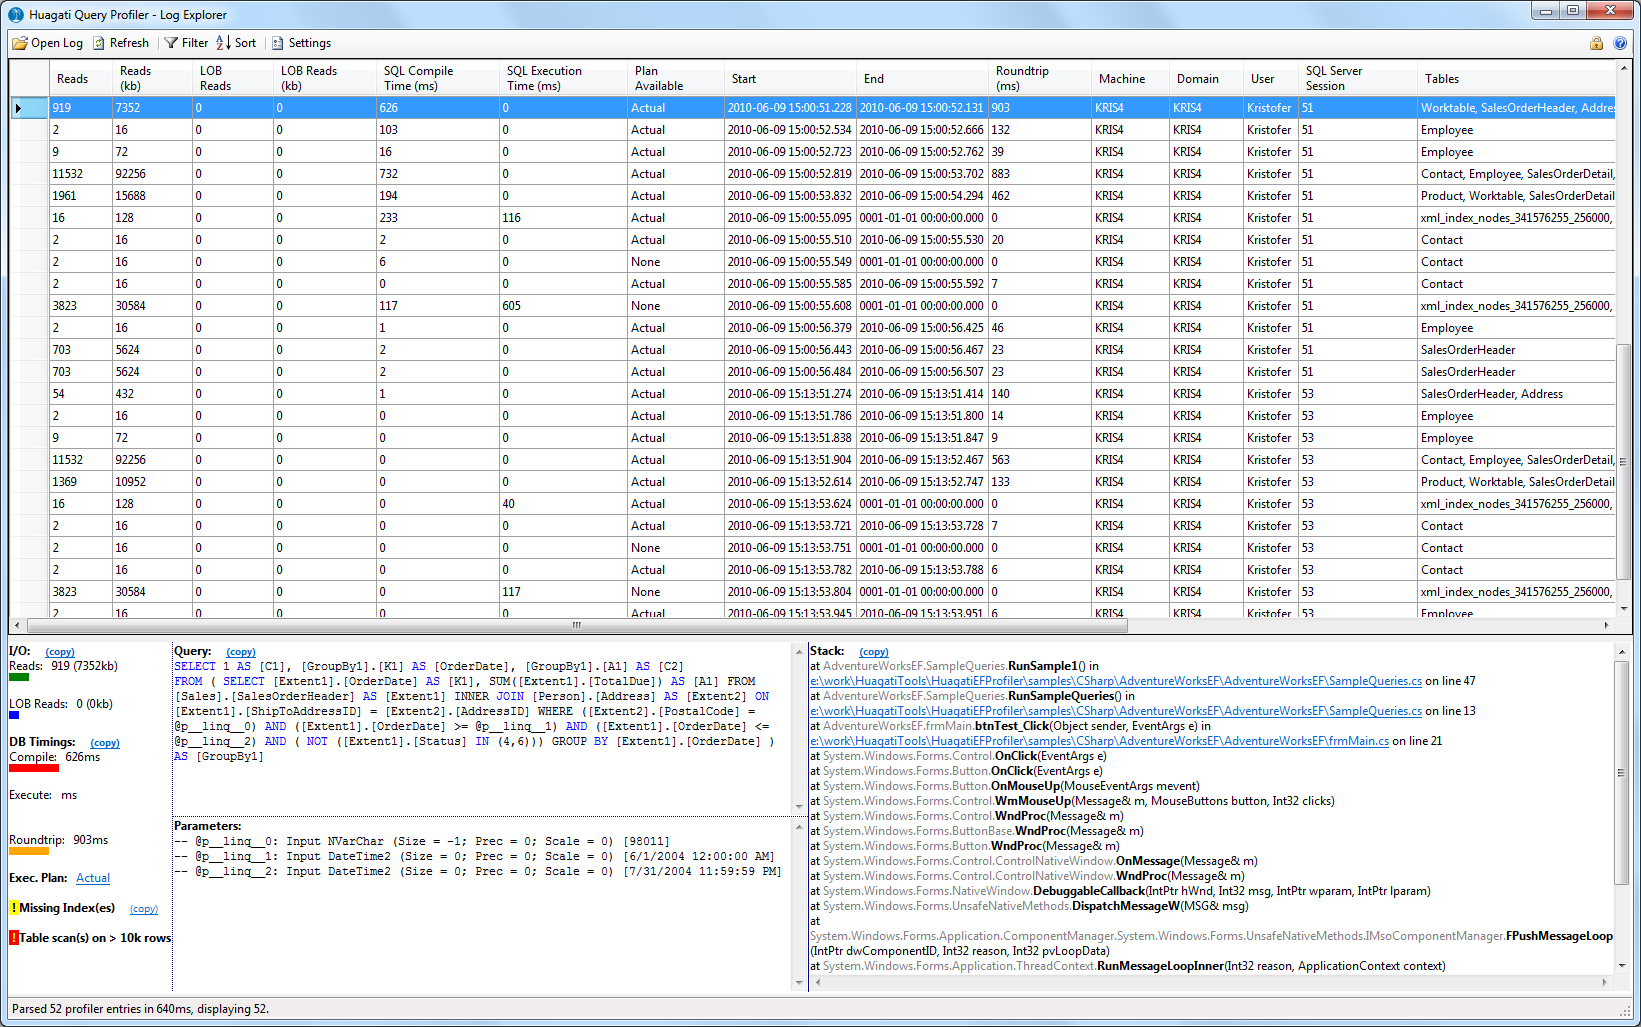
The Huagati Profiler Log Explorer main window
The Huagati Query Profiler Log Explorer main window (click for larger image)

The log explorer's main window is divided in a few different sections:

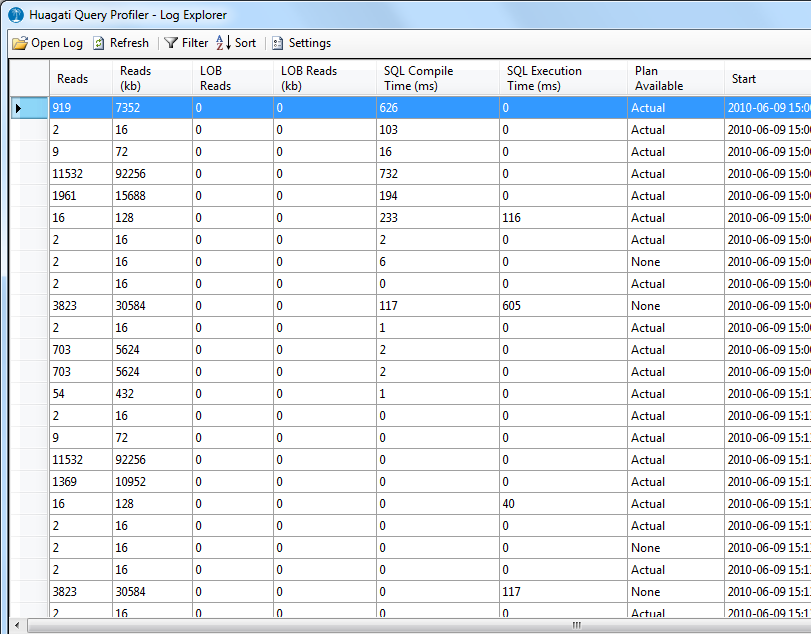
  • The top portion of the screen contains a grid listing all queries in the log or all queries passing the criteria set under the Filters option in the toolbar):

List of queries
Query list (click for larger image)

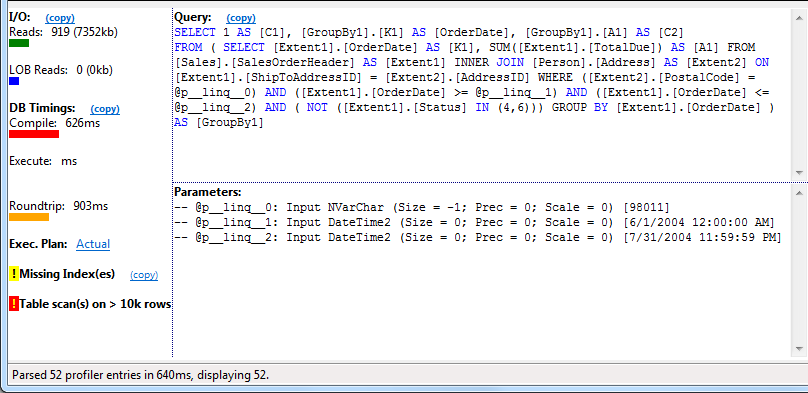
  • In the lower left portion of the screen it shows the query behind the currently selected log entry, along with visual indicators for I/O, timings, and feedback from SQL Server's optimizer:

Lower right corner: Query Information
Query details (click for larger image)

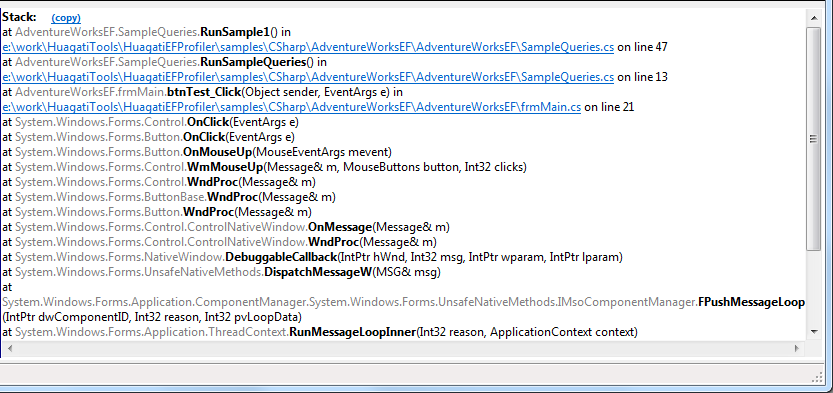
  • In the lower right portion of the screen it shows the call stack that led to the query being executed. If symbols (pdb) were present when the log entry was created, the call stack will contain convenient hyperlinks that can be used to open up the corresponding source code file on a developer machine.

Call Stack
Call stack (click for larger image)

Query information details

Many of the elements in the Query Information portion of the log explorer window will show additional details when hovered over, and/or when clicked on:

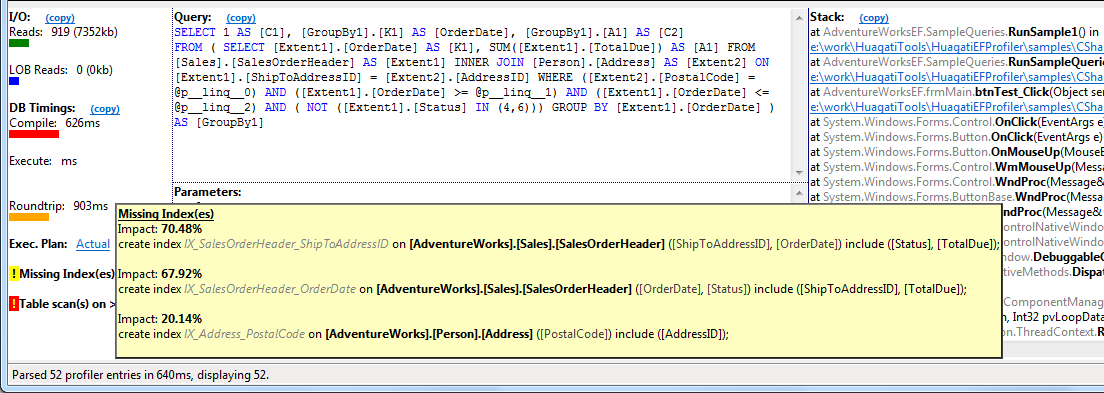
Missing Indexes hover popup
“Missing Indexes” alert with details in hover-popup (click for larger image) 

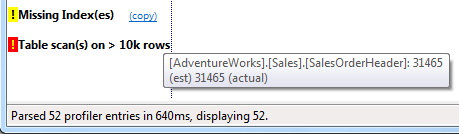
Table Scan alert with tooltip
Table scan alert with accompanying tooltip (click for larger image) 

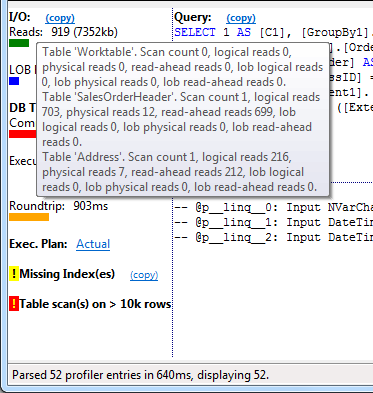
Query I/O cost
I/O statistics are shown when hovering over any of the I/O numbers or info bars

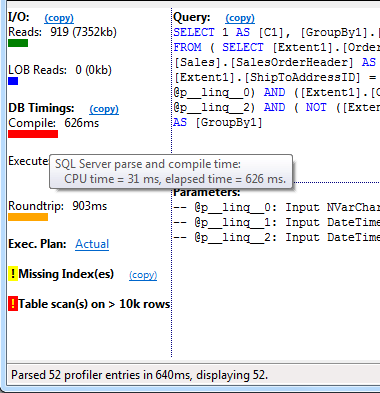
Query Timings
Timings are available by hovering over the timing numbers or indicator bars

Some of the links, such as the execution plan link or source code links will start up other applications such as SQL Server Management Studio or Visual Studio.

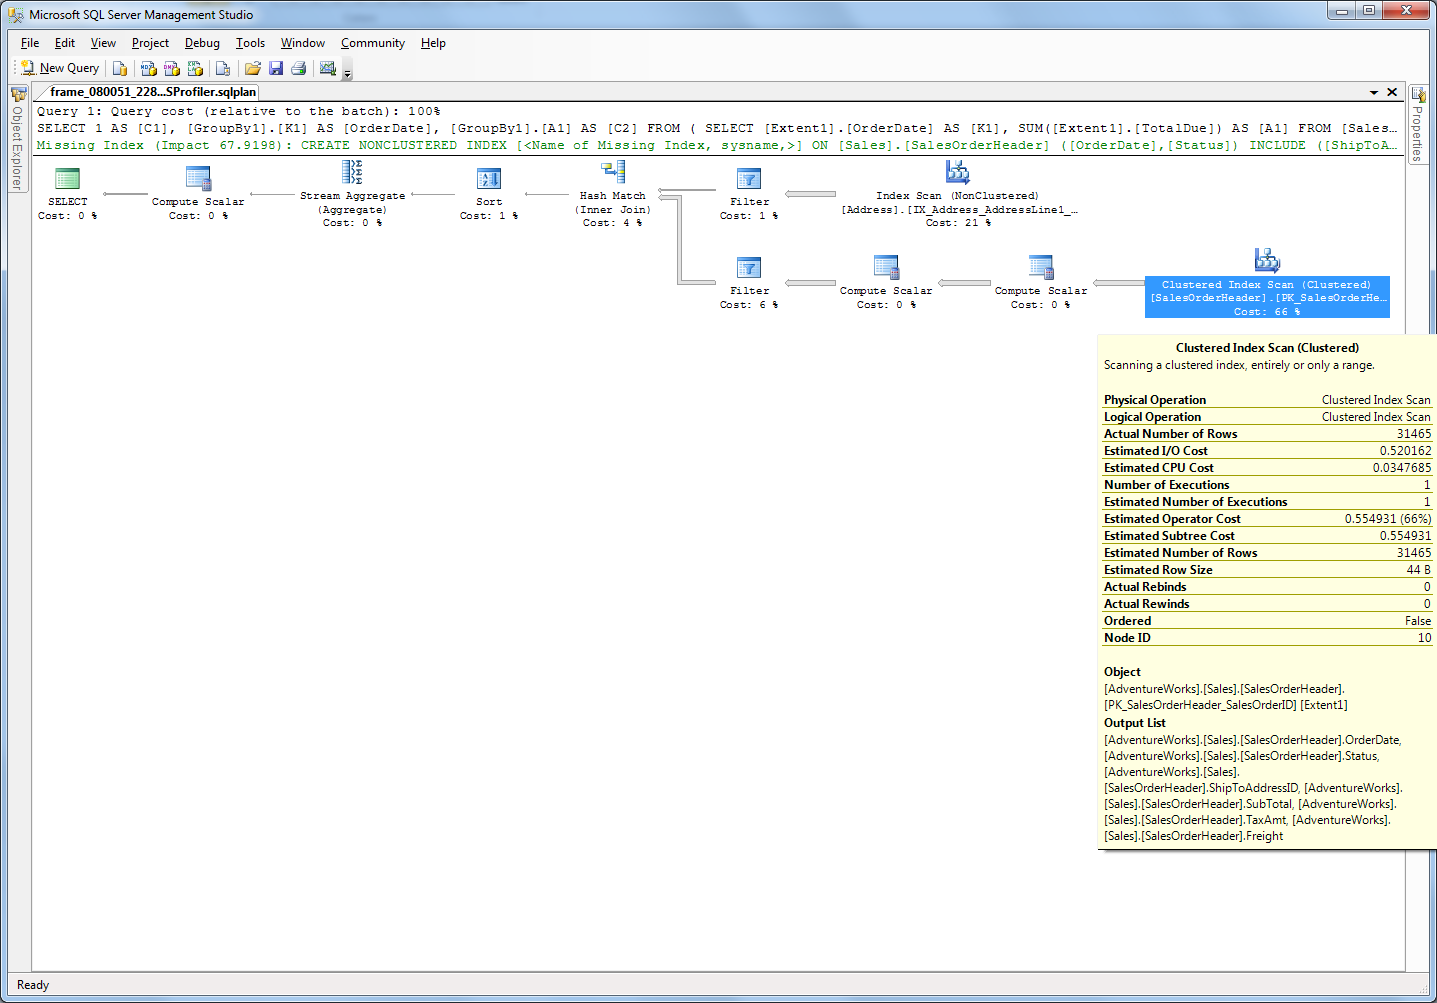
Clicking on the Execution Plan link for example will open up the logged execution plan for the query in SSMS:

Query execution plan in SSMS
Clicking on the “execution plan” link brings up SSMS with the logged execution plan (click for larger image)

Missing indexes sample

The particular sample query shown in the screenshots above has a missing index alert:

Missing index alert
Missing indexes alert (click for larger image)

A missing index alert means that SQL Server's optimizer determined that the query in question can be made more efficient by adding indexes to one or more tables involved. Hovering over the index alert will display the optimizer's suggested indexes.

In this case, the optimizer suggested three new indexes:

create index IX_SalesOrderHeader_ShipToAddressID on [AdventureWorks].[Sales].[SalesOrderHeader] ([ShipToAddressID], [OrderDate]) include ([Status], [TotalDue]);

create index IX_SalesOrderHeader_OrderDate on [AdventureWorks].[Sales].[SalesOrderHeader] ([OrderDate], [Status]) include ([ShipToAddressID], [TotalDue]);

create index IX_Address_PostalCode on [AdventureWorks].[Person].[Address] ([PostalCode]) include ([AddressID]);

However, looking closer at the optimizer's suggestions, two of the indexes can be combined into one to avoid overlap:

create index IX_Address_PostalCode on [Person].[Address] ([PostalCode])

create index IX_SalesOrderHeader_ShipToAddressID on [Sales].[SalesOrderHeader] ([ShipToAddressID], [OrderDate], [Status]) include ([TotalDue]);

After re-running the sample app and hitting Refresh in the log explorer we can see what the result of the new indexes were - in this case the query went from 919 reads and a table scan, down to to 54 and index seeks:

Sample Query #1 I/O after adding indexes
Query I/O for sample #1 after adding indexes as per above
 

Where do I get it, how do I get started?

The Entity Framework 4 logging component for the Huagati Query Profiler is included as of version 1.31, and is included in the installer that can be downloaded from http://huagati.com/L2SProfiler/

If you have an existing license for Huagati Linq-to-SQL Profiler or Huagati Query Profiler, you can simply install the latest version to get the EF logging component in addition to the Linq-to-SQL and LLBLGen logging components. If you don't have a license you can request a trial license key from:
http://www.huagati.com/l2sprofiler/


Additionally, during the beta period - if you become a beta tester and the provide feedback from your testing you will get a full license key for the final released version. To apply to become a beta tester, send an email to support (at) huagati.com.


Feedback and questions are always welcome, you can send your feedback or questions to support (at) huagati.com, or post it in the support forum, or post a comment in this blog.

24 June 2009

Profiling Linq-to-SQL applications

Profiling - why?

When developing database driven applications - especially apps with many users and different usage patterns - database performance is key to application performance and the database is often the 'resource bottleneck' when it comes to scaling applications to cope with a larger number of users.

If a certain operation spends a bit more time, CPU, and other resources client side it is often not as big of a matter scalability-wise as if it spends time or resources database-side/server-side. As the number of users in a large system grow, the impact of query costs - and savings of reducing it - is often the single most important factor to look at to improve performance and scalability, and the cheapest way to improve scalability.

Additionally, a production environment will often differ from test/development in ways that can affect how queries behave:

  • Applications are often used different in a production environment than what developers and designers envisioned; users may refresh 'screen x' twice as often as was envisioned during design and development, or use search filters in search screen differently than anyone thought.
  • SQL Server will often execute queries differently on different systems; depending on data volumes, available resources, system load, system and db configuration, and many other factors.

Because of this, runtime profiling live production systems can sometimes reveal bottlenecks and/or room for improvements/optimization that would not show up during development/test/QA, or on dev/test systems.

Profiling tools

There are many great tools available for investigating database performance at runtime / in production environments. The Microsoft tool stack offer some nice stuff for Linq-to-SQL and SQL Server based apps:

  • SQL Server Profiler is a really great tool that comes with the management tools for SQL Server (Standard edition and up, unfortunately it not available in Express edition).
  • Linq-to-SQL has a built in logging feature that allows executed queries to be written to log files by simply attaching a textwriter to the datacontext object.

To take this a step further, I have decided to throw a new tool onto the stack for L2S developers: a brand new profiler specifically targeting Linq-to-SQL applications.

But before we take a look at the L2S Profiler, a brief look at what comes out-of-the-box with SQL Server and Linq-to-SQL, and then what the L2S Profiler brings to the table compared to the existing tool stack.

SQL Server Profiler

Although SQL Server Profiler goes a long way when it comes to pinpointing what queries are causing the most stress db-side, it provides information from the SQL Server side of things only. It is built as a generic tool for all kinds of SQL Server profiling - not only queries but targeting other kinds of database activity as well. But a missing part is the application side of it: where did that query come from, what [user actions/calls] led to it being executed etc. In a large application with many developers involved this can make it time consuming to determine another important aspect who's code is responsible for hitting the database too frequently, or with too heavy queries, etc.

Add to that that SQL Server Profiler is made for DBAs, sys-admins, developers, and must be manually set up in a production environment. It can't be controlled from within applications, and it requires the person using it to know what they're looking for. It requires access to and privileges on the database server which is not always available in hosted environments, or in locked-down customer environments. It won't record execution plans so if you're reviewing a profiler log from a customer's system on your own system there is no way of determining what execution plan SQL Server used when it was executed.

Don't get me wrong: SQL Server profiler is an invaluable tool that I use on almost a daily basis, but there are some things it won't do that I would want it to.

Linq-to-SQL's DataContext.Log

So what about the built-in logging in Linq-to-SQL? It is a great feature as it stands, with a few lines of code you can get all SQL statements and queries generated by Linq-to-SQL written to a log file. Unfortunately you will then need to sort through them and manually determine which ones are a cause for concern and which ones are not. Time consuming to say the least as soon as query volumes creep up, and finding what queries can/need to be optimized quickly becomes a forest vs trees situation. Great for debugging locally, but beyond that at least I need more data and more filtering options.

Getting more into details

What if we are just interested in the where/what/who aspects of say...

  • Queries that hit a specific table?
  • Queries that do more than n I/O operations / page reads?
  • Queries that take longer than n milliseconds to execute?
  • Queries that generate specific SQL Server warning messages?
  • Queries that result in scans?

Finding those queries by hand in a large text file isn't going to be easy. Spotting them in SQL Server Profiler is easier provided that all the requirements for using it in the first place are satisfied. On the other hand, SQL Server Profiler won't give us the where/what/who; where in the application it came from, what caused it to run, or who'se code generated it.

Add to that that we may want to control the profiling/logging from within the application by for example app settings. If we want to profile just a specific part of an application in a runtime environment, and filter out only queries that are costly then the combination of SQL Server Profiler, SQL Server Management Studio and the out-of-the-box logging capabilities of Linq-to-SQL can add quite a bit of manual work to map the logs together.

Introducting the Huagati Linq-to-SQL Profiler

So, to bring the .net application side together with the database performance side of things, I put together the Linq-to-SQL Profiler. It consists of two main components:

  • A runtime component that is referenced from within an application and that can be distributed with your applications. It hooks into a combination of the Linq-to-SQL built in logging, the underlying database connections, and SQL Server's own features for retrieving I/O information, timings, execution plans etc, and combines that information into log files. It also has some advanced (and customizable) filtering options so you can instruct it to log only queries that fulfill certain criteria.
  • A log viewer that read the log files generated by the runtime component, provides additional filtering, sorting (which is not available in SQL Server Profiler), and shows not only what query was executed by also the managed call stack that caused to to run, SQL Server I/O and timings etc. If execution plan logging was enabled in the runtime component it also provides quick links to bring up the execution plan as it stood on the machine where the query was executed, from when it was executed.

The runtime component

The runtime component is a small DLL that you add as a reference in your Linq-to-SQL application. It won't do anything just by being referenced, but it adds some new capabilities to the Linq-to-SQL DataContext. It can be distributed freely together with your app, provided that you have a license for the profiler.

Using it is very simple; it has two methods (with a couple of overloads) that can be used to instruct it to start profiler logging (datacontext.BeginProfiling), and to end profiler logging (datacontext.EndProfiling). Depending on your usage scenario you can either call those methods inline from your app code or you can extend the partial DataContext class generated by the Linq-to-SQL designer to call the profiler logging methods whenever a datacontext is created/used.

The following code samples shows a couple of usage scenarios which can be used to use for example app settings to determine if logging should be enabled or not, and what logging options to use.

Example 1: a profiler enabled datacontext (C#)
Example 1: A profiler enabled datacontext partial class in C#

inlineProfilingSampleCS
Example 2: Inline profiling with C# as an alternative to profiling-enabled DCs

dcProfilingSampleVB
Example 3: A profiling enabled datacontext in VB.NET

inlineProfilingSampleVB
Example 4: Inline profiling in VB.NET as an alternative to profiling-enabled DataContexts

If you want to read more about the profiler runtime component API, check out the online help over at http://www.huagati.com/L2SProfiler/runtimehelp

The profiler viewer

The profiler viewer is a windows application that read the log files generated by the Linq-to-SQL Profiler runtime component. It has filter options and sorting to make it easier to find the 'worst offenders' or log entries that match more specific criteria than was used during the runtime logging.

ProfilerViewer

The profiler's screen is divided into two parts; the upper part shows all queries from the log (minus those filtered out by any filters set in the viewer) and the lower part shows the details; the query itself, the managed call stack, I/O and timings etc. The I/O and timing data is accompanied by visual indicators showing the relative impact of a query. The thresholds used by the visual indicators can be configured in the application settings.

ProfilerViewer_indicators ProfilerViewer_stackTraceProfilerViewer_query

The lower part of the screen can also be customized; the log files contain a lot more information than what is shown in the default view and the rendering of the lower part is done using XSLT style sheets that can be switched in the application settings dialog. This allows developers to create their own detail views focusing on the specific information they're interested in.

profilerSettingsDialog
The profiler settings dialog

Additional details such as the execution plan diagram, the source code involved, parameterized and 'sp_execute'-wrapped versions of the queries etc are available as hyperlinks in the detail view, but the same information can of course be visualized directly in a customized detail view template.

Taking it for a test spin

If you would like to take the profiler for a test spin, head over to the product page over at http://www.huagati.com/L2SProfiler/ , where you can download it and get a free 45-day trial license. After the trial expires I hope you're happy with it and want to continue using it. If so, please support continued development by purchasing a license (or a pile of licenses for your team :) ).

If you have any questions or concerns about the profiler, feel free to send an email to support@huagati.com, ask a question in the support forum (http://forum.huagati.com/forum4-huagati-linqtosql-profiler-support.aspx ), or drop a comment here on my blog.

Future features

There are of course new features are planned for the profiler, these will be made available as they're completed:

  • A centralized logging server that you can run to write logs to a database. It will have a web-based frontend very similar to the windows version of the profiler logger but is better suited for team environments where many people may want to access and work with the same logs.
  • More templates for the detail view in the profiler viewer
  • Additional filters; both runtime- and design time filters to help keep the log files focused on the interesting bits only.
  • Additional logging providers; if there is enough interest I may extend the runtime logging component to also support Entity Framework, plain ADO.NET, or other data access technologies such as 3rd party OR/Ms.

Fin.