The profiler's log file format and the profiler log viewer is not tied in any way to Linq-to-SQL specifically. Although the choice of name for the tool may not be ideal, it was designed to be used with other OR mappers and data access technologies as well.
A few weeks ago I contacted Frans Bouma, author of the popular LLBLGen Pro O/R Mapper Generator. LLBLGen Pro has been around for six years and is packed with great functionality; no doubt the market leading OR mapper for .net. Frans was enthusiastic about the idea, so we exchanged a couple of emails to determine the best approach to integrate profiler logging into LLBLGen based projects without requiring too much of an effort of work by end-users. Frans suggested using a partial class implementation of LLBLGen's DataAccessAdapter class, so that's the direction I went.
Due to some time constraints in other projects I had to suspend work on the LLBLGen profiler logging component for a couple of weeks, but it is now ready for release.
To enable query profiling in a LLBLGen based project, some minor additions are needed in the application to be profiled. A reference to the profiler logging assembly must be added, and a new partial class implementation of the LLBLGen Pro DataAccessAdapter containing calls to the profiler logger need to be included in the same project as the LLBLGen generated code.
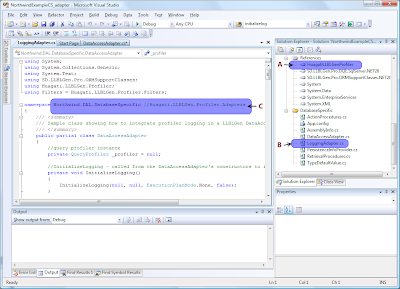
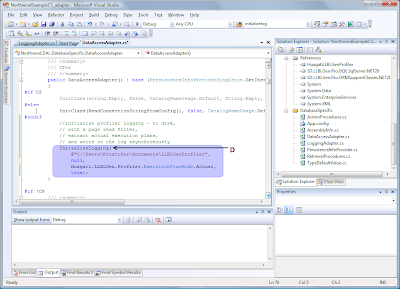
The following screenshots shows step-by-step how to enable query profiling in the LLBLGen Northwind Adapter sample project (downloadable from http://www.llblgen.com/pages/files/Example_NorthwindCS1_Adapter_06062008.zip ). Click on the individual screenshots for a full-size version.
Step 1: Add a reference to the profiler logging assembly (HuagatiLLBLGenProfiler.dll) (A), include LoggingAdapter.cs (B) (both are installed together with the profiler itself under C:\Program Files [(x86)]\Huagati Systems Co Ltd\Huagati Linq-to-SQL Profiler\redist ). Next, change the namespace in LoggingAdapter.cs to match the namespace of the application's own DataAccessAdapter class (C).
Step 2: Add a call to one of the InitializeLogging methods in the DataAccessAdapter's constructor(s). There are a few different overloads of InitializeLogging, depending on what logging features, filters, etc that you want to use.
Step 3: Compile and run the application.
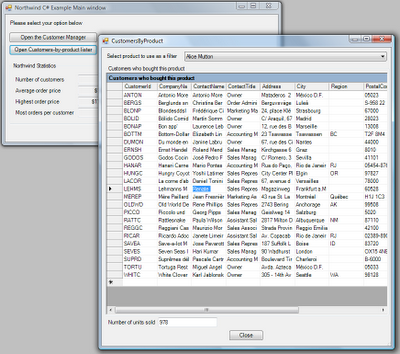
Step 4: Start the Huagati Linq-to-SQL Profiler Viewer, open the logging directory used, and have fun with the logs:
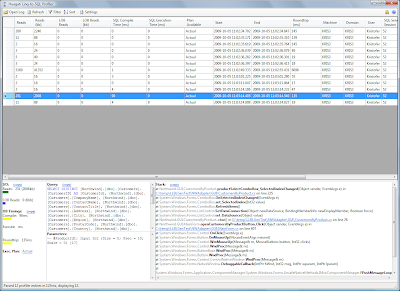
Just as when profiling a Linq-to-SQL application, the top part of the window shows log entries and the bottom part shows details such as I/O statistics, timings, call stack etc pertaining to the selected log entry. All blue underlined links are clickable and will bring up additional details; clicking on the execution plan link will open the execution plan diagram in SSMS, clicking on the source code links in the call stack will open up the source file linked to in Visual Studio and so on.
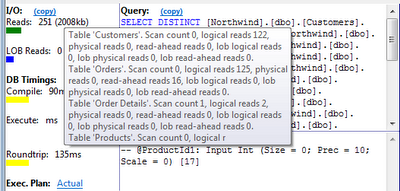
Database-side I/O statistics and timings are shown in easy-to-spot bars indicating the relative cost. Each one has a tooltip containing more detailed information from the database engine:
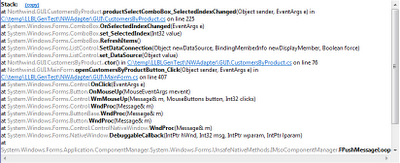
The call stack portion shows the call stack that led to a certain query being executed, with hyperlinks directly to the source code (whenever debug information and source code is available):
In short, it is as easy to get started with profiling LLBLGen based applications as it is to profile Linq-to-SQL based applications.
The filters available in the LLBLGen logging component are the same as the filters available in the Linq-to-SQL logging component. This means that after adding profiling to a LLBLGen app as in the steps above, the examples shown in "A walkthrough of the newest filters and visual cues in the Huagati Linq-to-SQL Profiler", and "Profiling Linq-to-SQL Applications" will work with the LLBLGen profiler logging component as well. Custom logging filters can of course also be added the same way; by creating a new class inheriting from the ProfilerFilter base class or from one of the pre-defined filters.
The profiler logging component for LLBLGen Pro is included in Huagati Linq-to-SQL Profiler version 1.20 (scheduled for release on Oct 12 2009).

does it only work if llblgen Adapter method has been selected?
ReplyDeleteno support for Self Servicing projects?