When I first introduced the Huagati Linq-to-SQL Profiler nearly a year ago, I mentioned that it would eventually support other data access technologies than just Linq-to-SQL. Second up was support for LLBLGen profiling released in October 2009. Now the turn has finally come to Microsoft’s Entity Framework 4.0.
The concept is the same, the packaging is the same, and existing licensed users of the profiler can simply install the latest version to add support for Entity Framework query profiling in addition to the already existing Linq-to-SQL and LLBLGen profilers.
Why? Why not use SQL Profiler instead?
Database performance, and conserving db-side resources is often key to app performance in database driven applications. There are many tools around for profiling, and there can sometimes be an overlap between what they do.
The Huagati Query Profiler bridges the gap between SQL Server and OR-mapper code. It collects important information about queries executed by Linq-to-SQL, Entity Framework, and LLBLGen and combines that information with stack traces and other details that make it easier to find out what code in an application is responsible for the most expensive or most long-running database queries. It overlaps with the SQL Server Profiler in collecting query information, with Visual Studio, and with SQL Server Management Studio, but adds the benefit of linking information otherwise available separately in each of the three applications together.
What does it do? How does it work?
The profiler consists of two main parts:
- A redistributable runtime DLL that you can reference from and include with your applications. There is one runtime logging DLL for each of EFv4, L2S, and LLBLGen. The runtime logging DLL collects information about what queries are executed against the database along with useful information such as timings, I/O cost, execution plans, and various feedback from SQL Server's query optimizer.
- The profiler log explorer application that is used for exploring logs generated by the runtime DLL, and examining individual log entries in more detail.
Filters
Filters can be set up in both layers; in the runtime component to avoid logging non-costly queries or to narrow down on specific types of query behavior, and in the log explorer to narrow down specific types of queries when examining existing logs.
The logging components have several built-in filters, and custom filters can easily be added if needed.
Code samples
After installing the profiler, Windows Programs menu will get a new program group called Huagati Query Profiler:
The first entry, Code Samples (zip) will open up a zip file containing a handful of sample Visual Studio projects in C# and VB. The sample projects shows how to integrate the runtime component with an existing application, and includes sample queries showing some typical operations. The Entity Framework 4 sample is called AdventureWorksEF and it uses the Microsoft AdventureWorks sample database.

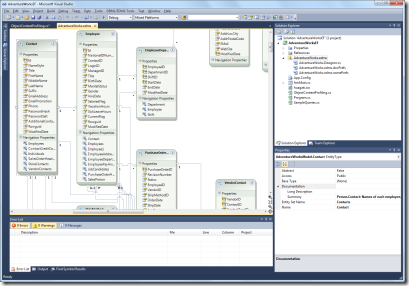
AdventureWorks EF model in VS2010 (click for larger image)

Sample ObjectContext with EF Profiling support added (click for larger image)
The UI of the sample project is simple, a small form with a single button. Behind the button are several sample queries, some doing a simple primary key lookup, others doing group/aggregate queries etc.

Query in the code samples project (click for larger image)
To generate some sample log entries for the log explorer, run the sample project and click on the Test! button.

Code sample project UI: a single button
Before running the sample project, ensure that the connection string in app.config is pointing to where you have installed the Microsoft AdventureWorks sample database.
The profiler log explorer
After generating log entries, start up the Profiler Log Explorer (Start/All Programs/Huagati Query Profiler/Huagati Query Profiler-Log Explorer).

The Huagati Query Profiler Log Explorer main window (click for larger image)
The log explorer's main window is divided in a few different sections:
- The top portion of the screen contains a grid listing all queries in the log or all queries passing the criteria set under the Filters option in the toolbar):

Query list (click for larger image)
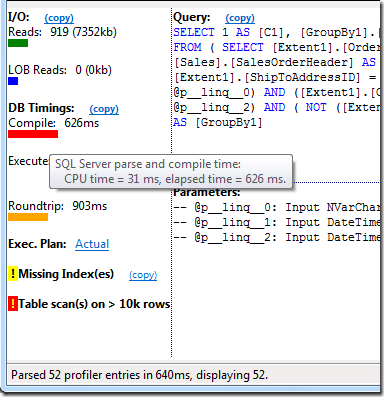
- In the lower left portion of the screen it shows the query behind the currently selected log entry, along with visual indicators for I/O, timings, and feedback from SQL Server's optimizer:

Query details (click for larger image)
- In the lower right portion of the screen it shows the call stack that led to the query being executed. If symbols (pdb) were present when the log entry was created, the call stack will contain convenient hyperlinks that can be used to open up the corresponding source code file on a developer machine.

Call stack (click for larger image)
Query information details
Many of the elements in the Query Information portion of the log explorer window will show additional details when hovered over, and/or when clicked on:

“Missing Indexes” alert with details in hover-popup (click for larger image)

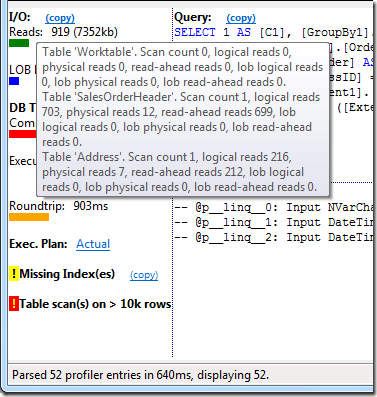
Table scan alert with accompanying tooltip (click for larger image)

I/O statistics are shown when hovering over any of the I/O numbers or info bars

Timings are available by hovering over the timing numbers or indicator bars
Some of the links, such as the execution plan link or source code links will start up other applications such as SQL Server Management Studio or Visual Studio.
Clicking on the Execution Plan link for example will open up the logged execution plan for the query in SSMS:

Clicking on the “execution plan” link brings up SSMS with the logged execution plan (click for larger image)
Missing indexes sample
The particular sample query shown in the screenshots above has a missing index alert:

Missing indexes alert (click for larger image)
A missing index alert means that SQL Server's optimizer determined that the query in question can be made more efficient by adding indexes to one or more tables involved. Hovering over the index alert will display the optimizer's suggested indexes.
In this case, the optimizer suggested three new indexes:
create index IX_SalesOrderHeader_ShipToAddressID on [AdventureWorks].[Sales].[SalesOrderHeader] ([ShipToAddressID], [OrderDate]) include ([Status], [TotalDue]);
create index IX_SalesOrderHeader_OrderDate on [AdventureWorks].[Sales].[SalesOrderHeader] ([OrderDate], [Status]) include ([ShipToAddressID], [TotalDue]);
create index IX_Address_PostalCode on [AdventureWorks].[Person].[Address] ([PostalCode]) include ([AddressID]);
However, looking closer at the optimizer's suggestions, two of the indexes can be combined into one to avoid overlap:
create index IX_Address_PostalCode on [Person].[Address] ([PostalCode])
create index IX_SalesOrderHeader_ShipToAddressID on [Sales].[SalesOrderHeader] ([ShipToAddressID], [OrderDate], [Status]) include ([TotalDue]);
After re-running the sample app and hitting Refresh in the log explorer we can see what the result of the new indexes were - in this case the query went from 919 reads and a table scan, down to to 54 and index seeks:

Query I/O for sample #1 after adding indexes as per above
Where do I get it, how do I get started?
The Entity Framework 4 logging component for the Huagati Query Profiler is included as of version 1.31, and is included in the installer that can be downloaded from http://huagati.com/L2SProfiler/
If you have an existing license for Huagati Linq-to-SQL Profiler or Huagati Query Profiler, you can simply install the latest version to get the EF logging component in addition to the Linq-to-SQL and LLBLGen logging components. If you don't have a license you can request a trial license key from:
http://www.huagati.com/l2sprofiler/
Additionally, during the beta period - if you become a beta tester and the provide feedback from your testing you will get a full license key for the final released version. To apply to become a beta tester, send an email to support (at) huagati.com.
Feedback and questions are always welcome, you can send your feedback or questions to support (at) huagati.com, or post it in the support forum, or post a comment in this blog.


No comments:
Post a Comment